Inverse Fair Value Gaps Simplified (Full Breakdown)
 PT15M42S
Mar 2, 2026, 6:30 PM•PT15M42S
 PT15M42S
 PT45M13S
 PT23M14S
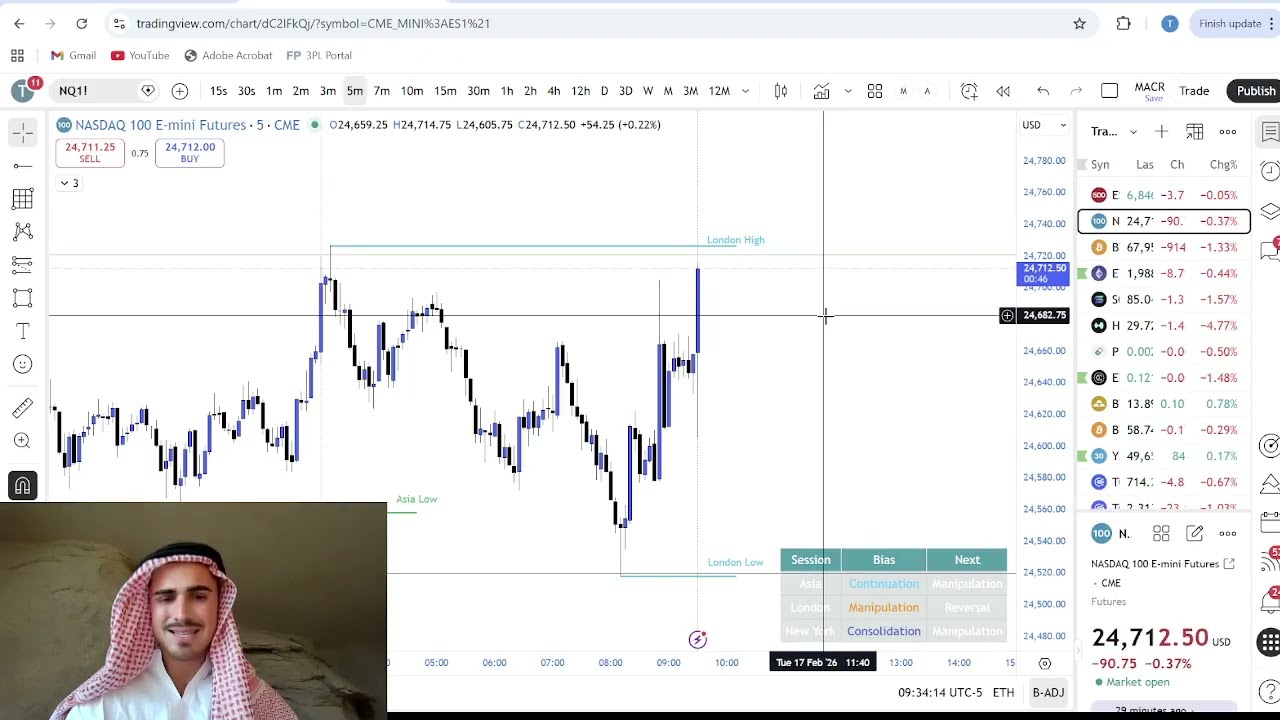 PT51M27S
 PT20M6S
 PT17M22S
 PT14M53S
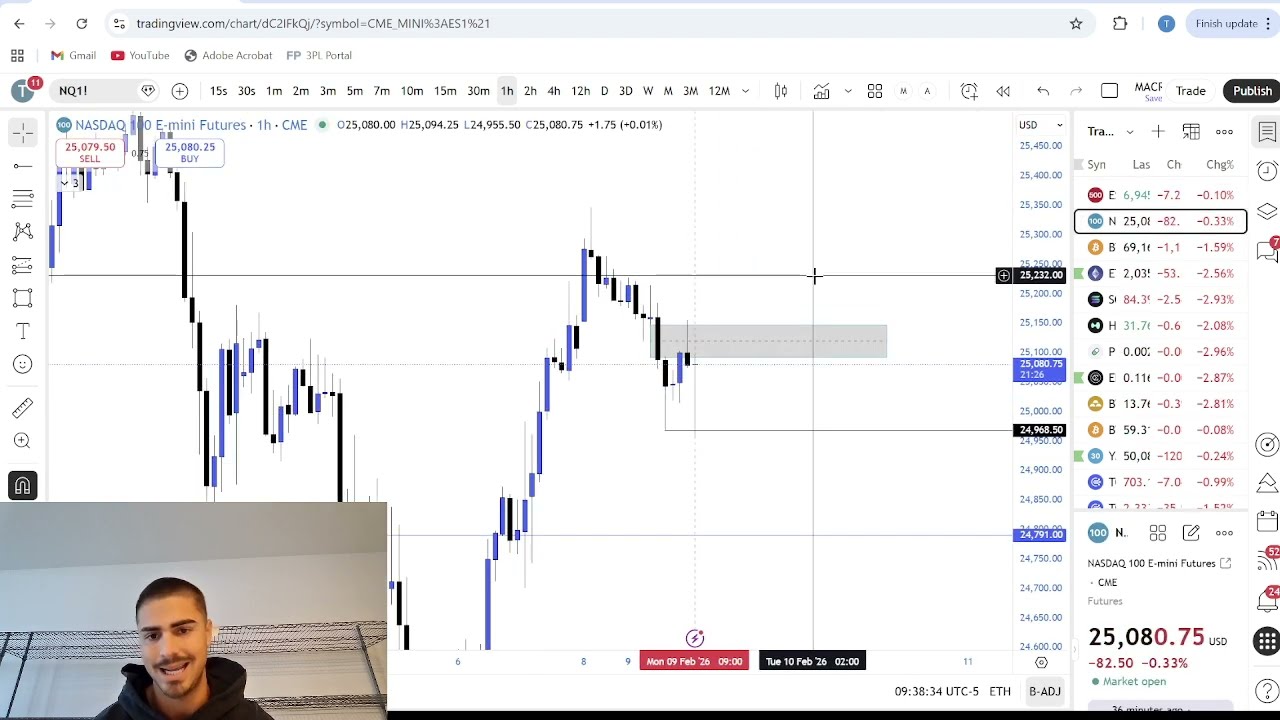 PT1H3M14S
 PT26M1S
 PT51M26S
 PT18M39S
 PT42M38S
 PT22M54S
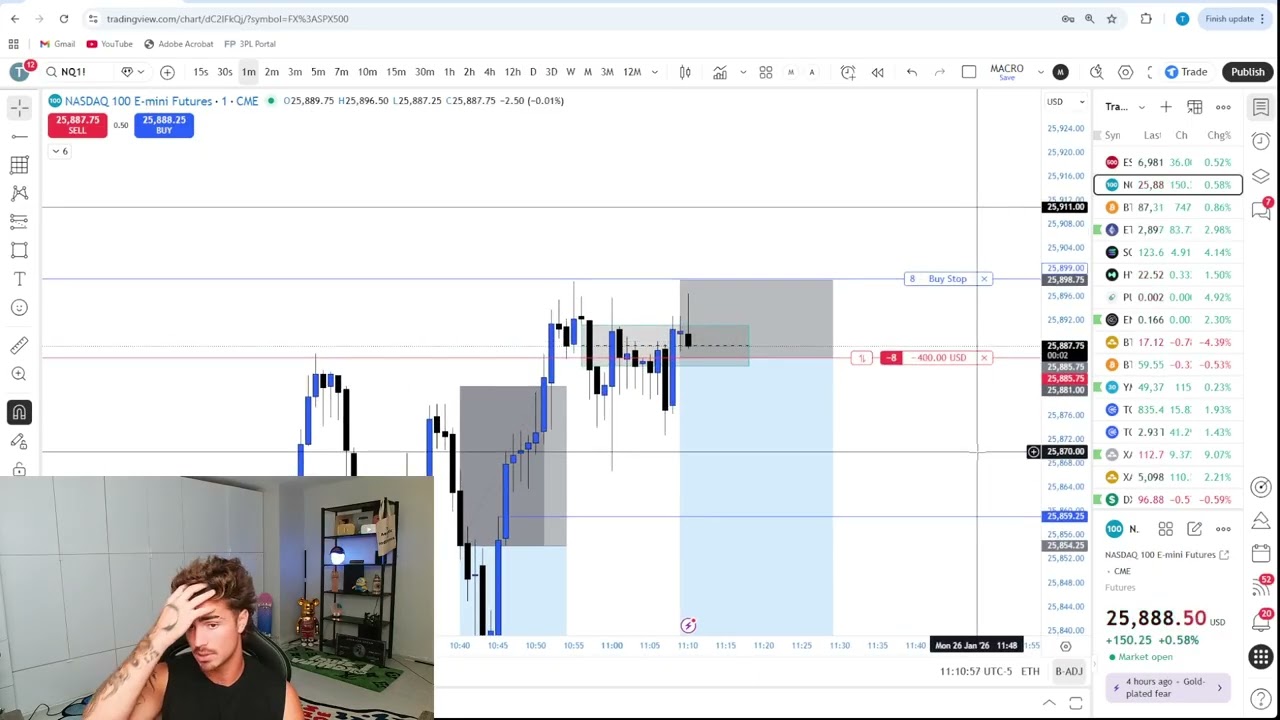 PT18M54S
 PT1H7M16S
 PT2H9M48S
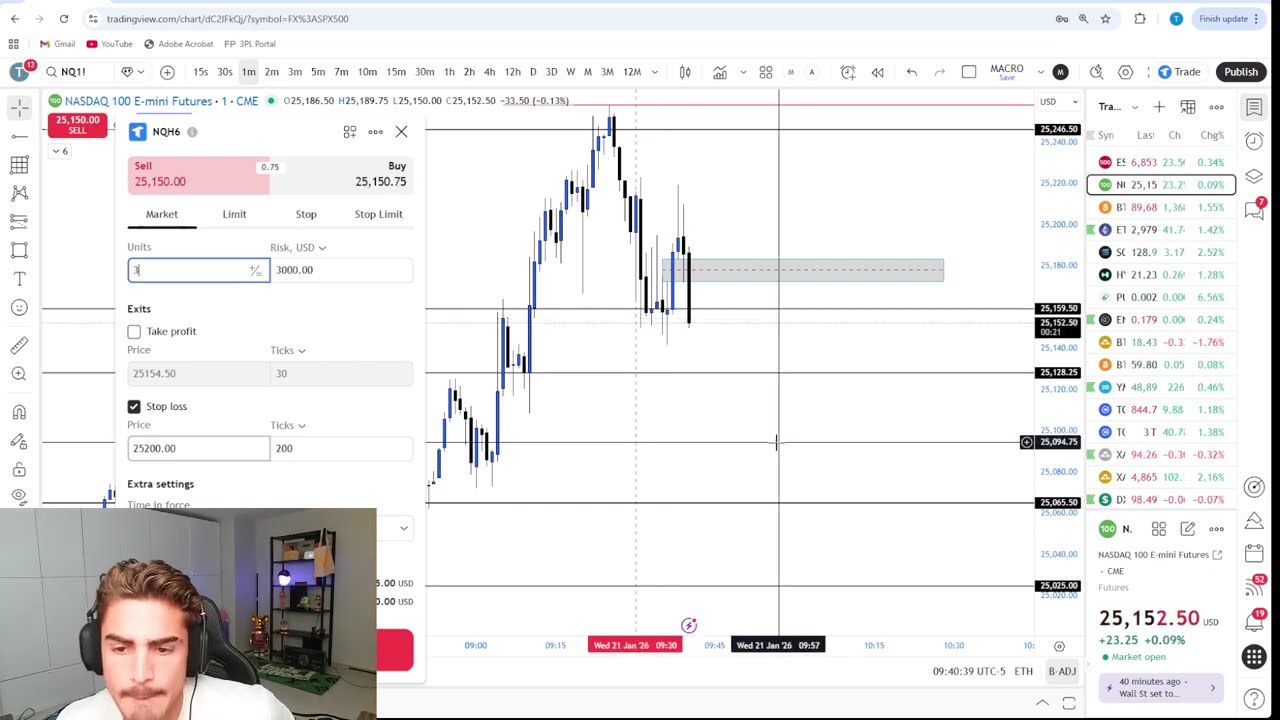 PT1H15M41S
 PT42M
PT42M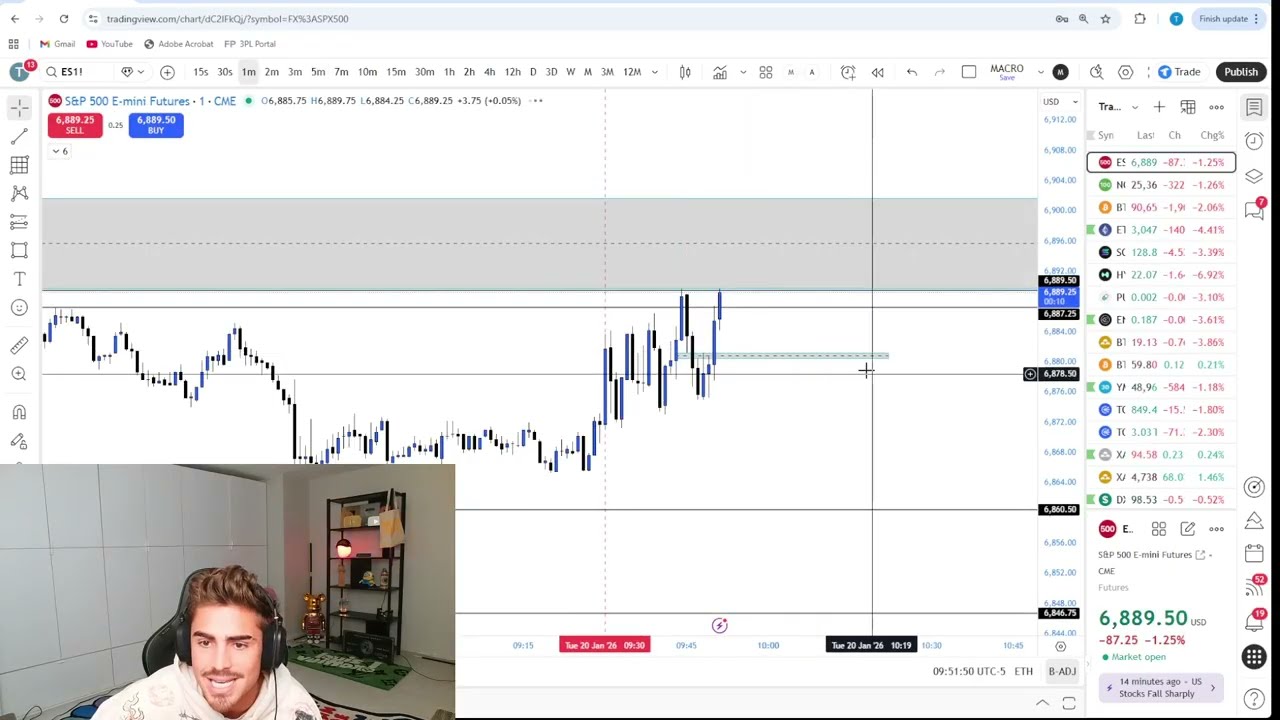 PT50M56S
 PT43M11S
 PT18M37S
 PT47M9S
In this live stream the trader walks through pre‑market analysis of ES and NASDAQ, evaluates bullish and bearish SMT divergences, 4‑hour gap inversions, and risk management before the market opens. After a volatile start he reverses a losing month, securing roughly $73 k‑$93 k in profit on the day while detailing position sizing, stop‑loss adjustments, and his plan to hit the final take‑profit target.
 PT26M49S
In this live day‑trading session the streamer anxiously watches NASDAQ and ES price gaps, repeatedly flipping between bullish and bearish bias as he tries to catch short‑term reversals, only to see the market invalidate his entries and stack massive losses. The chaotic commentary culminates in a staggering $161,430 loss, pushing his monthly deficit past $220 K while he vents frustration at the chat and his own trading decisions.
 PT30M56S
In this tutorial, the instructor breaks down how to determine daily market bias by analyzing high‑time‑frame trends, liquidity draws, and fair‑value gaps, then walks through live bearish and bullish examples that illustrate where price is likely to move and where entry targets may lie. He also previews the next session on risk management and trade execution, linking bias identification to actionable trading plans.
 PT34M25S
In this live stream the trader reacts to PPI news, applying bearish SMT patterns, fair‑value gap analysis and liquidity draws on NQ, ES, and NASDAQ to time short entries as the market opens. After fast‑paced trading, multiple profit‑taking moves and stop‑loss adjustments, the session wraps up with a reported profit of $67,680.
 PT19M37S
In this video the creator breaks down how prop‑firm funded accounts work, why they’re a powerful tool for low‑capital traders, and what skills are required to pass the evaluation challenges, while comparing the main plans from Alpha Futures and Tradeify. He also shares detailed account rules, payout structures, and exclusive discount codes (TJR40 and TJR) to help viewers save on activation fees.
 PT11M1S
In this video the instructor breaks down the three major trading sessions (Asian, London, and New York) and highlights the critical New York‑time windows—9:30‑9:50 a.m. ET for market manipulation and 9:50‑10:10 a.m. ET for optimal entry—illustrating how recognizing these periods can boost high‑probability daily trades on US indexes. Real‑time chart examples demonstrate the pattern, and the presenter previews the next lesson on funded accounts and prop‑firm strategies.
 PT16M4S
This video breaks down SMT (Smart Money Transfer) divergence, showing how comparing the S&P 500 and NASDAQ highs and lows during significant liquidity draws can reveal early trend‑change signals. It then demonstrates how to identify bullish and bearish divergences, distinguish the leading from the lagging index, and apply the concept for trade bias across multiple timeframes.
 PT14M24S
In this tutorial, TJR breaks down the equilibrium confluence, showing how to draw it from the most recent swing low to high in an uptrend (or high to low in a downtrend) to identify premium and discount zones for trend‑continuation trades. He also demonstrates using equilibrium alongside fair‑value gaps and liquidity sweeps across multiple time frames, emphasizing its role in spotting retracement entry points and maximizing profitability.
 PT22M31S
.In this lesson, TJR breaks down inverse fair value gaps—fair value gaps that are disrespected within the prevailing trend—and shows how they can be used as a confirmation confluence to spot trend changes before a traditional break of structure. Real‑time chart examples illustrate entry timing, risk‑to‑reward improvements, and handling stacked gaps, preparing traders for the next continuation confluence (equilibrium).
 PT23M4S
.In this advanced session the instructor breaks down several types of market imbalances—including new‑day, new‑week and new‑candle opening gaps and the BPR (imbalanced price range) pattern—explaining how they can serve as entry points or price targets and illustrating each concept with live chart examples. He also revisits fair‑value gaps, shows how they interact with these imbalances, and tees up a follow‑up video on inverse fair‑value gaps.
 PT1H3M37S
.In this live day‑trading stream the host dissects London, Asia and New York session dynamics, attempts short‑term shorts on NASDAQ and ES using high‑timeframe confluences, and battles poor fills and volatile price swings that culminate in a $97,421 loss, leaving him $122 K down for the week. He then reflects on the pitfalls of chasing drawdowns, the importance of disciplined risk management, and his plans around upcoming economic releases like non‑farm payroll.
 PT13M55S
In this high‑energy live session the trader scalps the 1‑minute chart, using triple equal highs and five‑minute low sweeps on ES and NASDAQ to trigger a rapid long, ultimately locking in $42,510 profit in minutes. The video walks through his real‑time decision‑making, stop‑loss adjustments, and exit strategy while highlighting the volatility and psychological dynamics of ultra‑short‑term day trading.
 PT33M43S
.In this video the creator breaks down fair value gaps—three‑candle imbalances where the top wick of the first candle and the bottom wick of the third leave a price void—and shows how to spot bullish and bearish gaps, why they matter for trend continuation, and how to treat stacked gaps, respecting or discarding them based on subsequent price action. Viewers also learn common pitfalls, how to identify gaps that are “disrespected,” and how to integrate FVGs with other confluences for a more reliable trading strategy.
 PT44M44S
Join the streamer as he navigates the market open, targeting equal low liquidity zones and PMI releases to execute a live day‑trade that ultimately nets $25,400 in profit. Throughout the session he explains his use of session highs/lows, SMT divergences, and risk‑management tactics while reacting to chat and market swings.
 PT12M23S
In this quick lesson, the instructor breaks down “break of structure” — the point where bullish or bearish market patterns flip when a candle closes below the most recent low or above the most recent high — and shows how to spot these shifts on real‑time charts. He also explains how this confluence works alongside liquidity sweeps and fair‑value gaps to confirm order‑flow changes and improve trade entry decisions.
 PT53M44S
In “Path to Profitability: Advanced Liquidity Concepts,” the host breaks down high‑probability liquidity draws—including session, daily, and low‑resistance highs and lows—and shows how new money from Asian, London, and New York sessions manipulates these levels to create trading opportunities. Real‑chart examples illustrate how to identify and use these liquidity zones for both entry and exit points, giving traders a clearer edge in the market.
 PT10M40S
.In this live recap TJR Trading walks viewers through his first New‑Year trade, which was liquidated for about $99,500 as a short on the Nasdaq/E‑mini despite multiple high‑time‑frame and low‑time‑frame SMT divergences, a fair‑value‑gap fill, and a break of structure. He then breaks down the bullish macro news that triggered the stop‑loss, and promotes his daily “Path to Profitability” series and mentorship program that offers live coaching and trade reviews for aspiring traders.
 PT35M39S
In this episode TJR breaks down liquidity as the resting buy and sell orders that cluster above recent highs and below recent lows, explaining how these clusters drive price movement and give market makers the order flow they need to push trends. He then demonstrates chart examples of liquidity sweeps, reveals why most retail traders trade the wrong side, and outlines a basic framework for using this insight to improve trade timing.
 PT41M15S
In this beginner‑focused episode, the host walks viewers through setting up TradingView, explains Japanese candlestick anatomy, and shows how to spot highs, lows, and trends across multiple time frames. He also contrasts technical versus fundamental analysis and outlines the basic concepts needed to predict price moves before diving into advanced liquidity and imbalance strategies.