After Silver CRASHES 40%: Is the Bottom In or Is $50 Next? Technical Analysis Deep Dive
 PT12M29S
Feb 2, 2026, 6:45 PM•PT12M29S
 PT12M29S
 PT11M17S
 PT12M26S
 PT11M7S
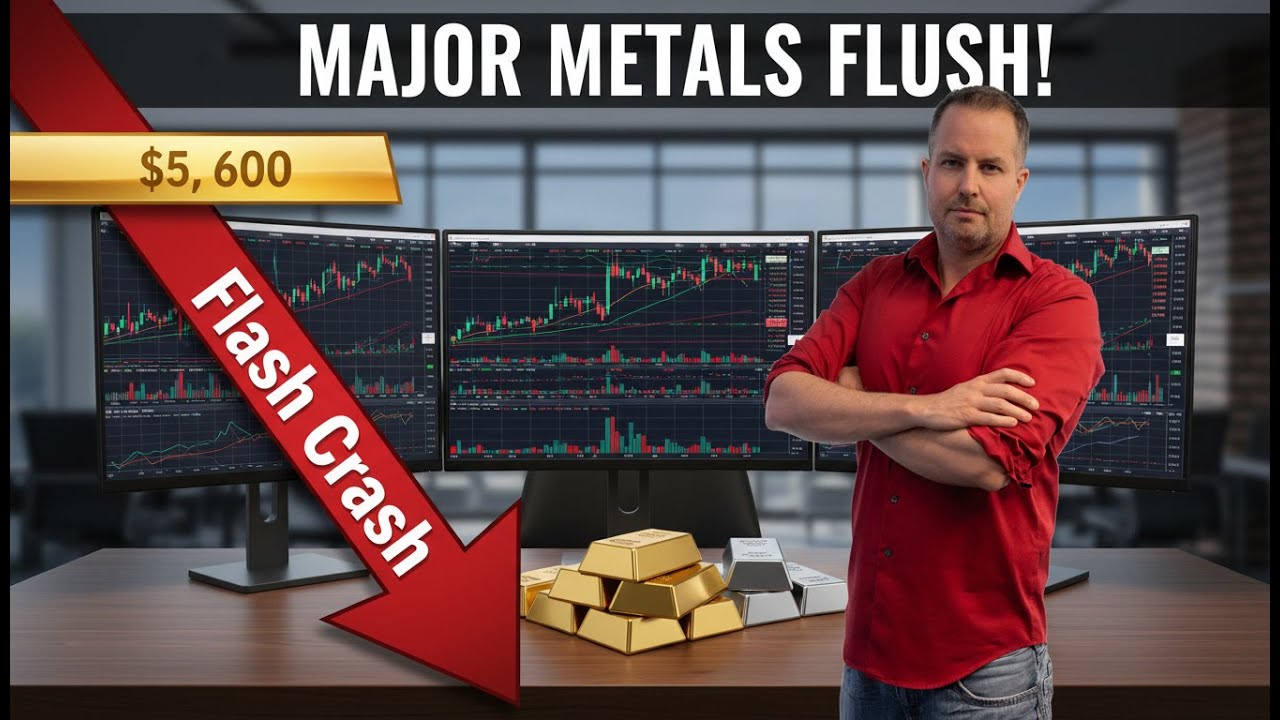 PT9M49S
 PT9M4S
 PT9M6S
 PT11M17S
 PT12M45S
 PT11M23S
 PT8M35S
 PT9M51S
 PT8M45S
 PT10M10S
 PT10M30S
In this video Gareth Soloway breaks down the recent metal surge, showing how silver’s 8% overnight spike sits inside a long‑running parallel channel and is now exhibiting a classic RSI negative divergence that signals institutional unloading and a likely short‑term pullback toward the $80‑$90 range. He then applies the same RSI analysis to gold, highlighting a converging wedge pattern and a weakening RSI that could point to massive dumping by big money, while still leaving open the possibility of a breakout toward the $5,000 level later in the year.
 PT11M7S
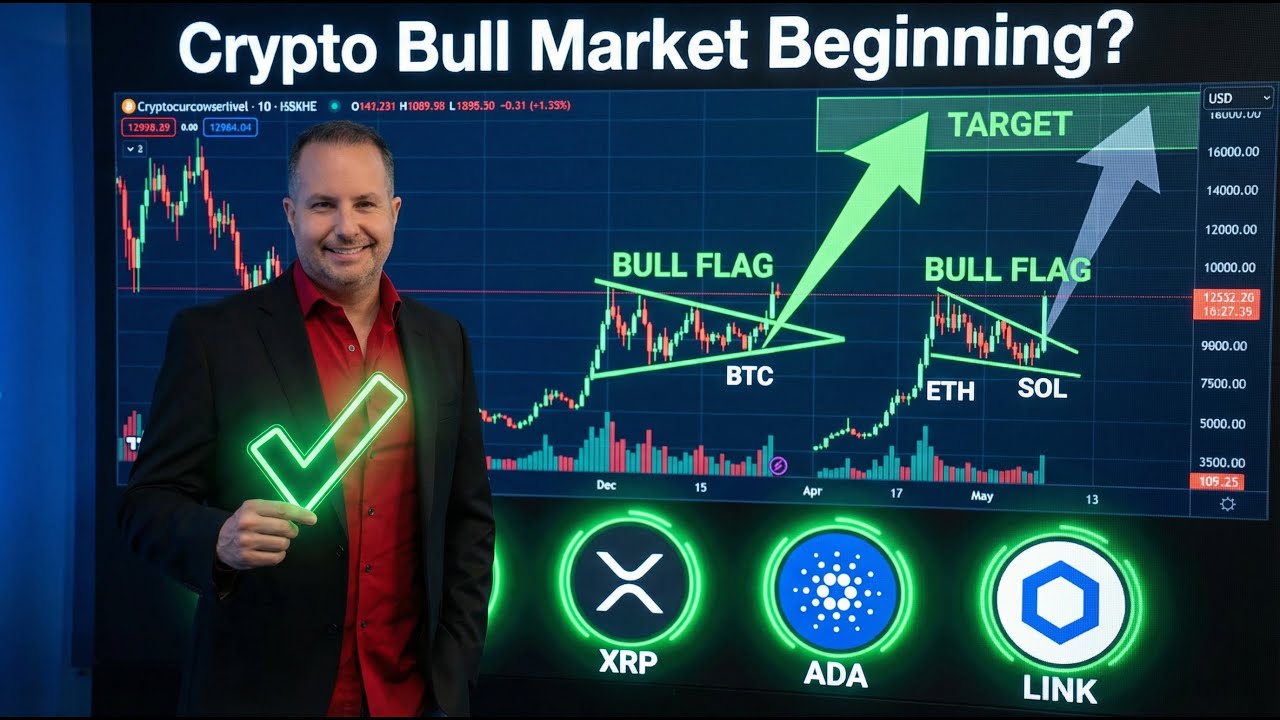
Chief market strategist Gareth Soloway breaks down the latest crypto bullish patterns, highlighting bull flags on altcoins, Bitcoin’s bare‑flag consolidation with a $100,000 upside target, and key support/resistance levels for ETH, XRP, Solana, Cardano and Chainlink. He also shares his institutional swing‑trading mindset, entry/exit tips, and psychological strategies for navigating short‑term moves in the crypto market.
 PT11M30S
In this market update, chief strategist Gareth Soloway warns that the U.S. 10‑year Treasury yield is forming a bullish “bull‑flag” breakout while Japanese yields surge, putting pressure on bonds and pushing major equity indexes to critical resistance zones that could trigger sharp reversals. Simultaneously, he points out a weakening dollar and yen versus strengthening euro, pound and Canadian dollar, suggesting that currency turbulence combined with rising yields may unleash the long‑awaited “bond vigilante” rally and heightened market volatility.
 PT9M9S
In this video, Gareth Soloway of VerifiedInvesting analyzes the current gold and silver charts, showing that a daily close above key trend‑line levels could propel gold toward $5,000 and silver toward $100 per ounce. He then scans platinum, palladium, copper and the broader macro backdrop, tying recent Fed‑related political risk to the metals rally while stressing that his outlook is based on pure technical probabilities, not hype.
 PT12M17S
Gareth Soloway breaks down the latest altcoin rally, highlighting a bullish ETH wedge that needs to break above $3,200 to spark a 20‑25% move, and pointing out buy‑the‑dip opportunities such as XRP around $2, plus bull‑flag patterns and key support levels in SOL, ADA, LINK and AVAX. He emphasizes tight risk‑reward setups, stop‑loss thresholds, and his swing‑trading methodology for capitalising on these short‑term bullish legs while keeping losses small.
 PT10M35S
In this video chief market strategist Gareth Soloway breaks down the critical technical levels for the S&P 500, Dow, Nasdaq and Russell 2000, explaining how long‑term trend lines and parallels around 7,000 on the S&P and 50,000 on the Dow set up a make‑or‑break week that could trigger a 10% correction or a new rally. He highlights the potential scenarios—double‑tap rejection, modest Nasdaq upside, or a breakout to higher highs—while warning that earnings season and market psychology will dictate whether the indices surge or slump in the coming days.
 PT9M1S
In this update, chief market strategist Gareth Soloway confirms that crude oil has finally broken above a descending trend line, projecting a 25% rally toward the 2024‑2025 pivot‑high zone and recommending USO as the primary way to trade the move. He also points out that natural gas has slipped to a major technical support level, suggesting a 17‑21% bounce off that zone with UNNG as the corresponding ETF and outlining entry, stop‑loss and averaging strategies.
 PT11M50S
.Gareth Soloway walks viewers through a detailed technical‑analysis of gold, silver, palladium and platinum, pinpointing key chart patterns—wide‑range reversal candles, converging trend‑line wedges, and major resistance levels such as $4,550 for gold, $90‑$100 for silver, $1,900‑$2,350 for palladium and around $2,500 for platinum—to illustrate where breakout or breakdown moves may occur. He stresses that these signals are probabilistic, not guarantees, and encourages investors to let the charts, rather than hype, drive their trading decisions.
 PT12M7S
In this video, Verified Investing’s chief market strategist Gareth Soloway breaks down how his recent technical‑analysis calls correctly predicted Bitcoin’s surge toward the $95‑$100 k range and Ethereum’s potential rise to around $3.7 k, using support zones, parallel trends, and wedge‑pattern dynamics that also explained the 20‑30% gains in altcoins such as SOL, ADA and SUI. He emphasizes that while short‑term macro risks remain, swing traders should let the charts—not emotions or hype—drive their decisions to maintain a high win rate.
 PT8M33S
two sentences.Gareth Soloway debunks the weekend hype of sub‑$50 oil by pointing out three key reasons why prices won’t collapse: Venezuela’s antiquated infrastructure and lengthy upgrade timeline, the geopolitical complexities of a regime change (especially China’s opposition), and the profit‑driven incentive of major oil companies to keep prices above $50. He then backs his bullish outlook with technical analysis—a potential breakout above $58, a bull‑flag inside‑bar, and firm trend‑line support—that could push oil toward $75 + per barrel by 2026 if the chart holds.
 PT11M6S
two sentences.Chief market strategist Gareth Solomay warns that the S&P 500 and NASDAQ are poised for a potential 20% correction by mid‑2026, hinging on imminent wedge‑pattern breakouts expected by early February for the S&P and mid‑January for the NASDAQ. He ties this risk to a looming dollar collapse, rising 10‑year yields, and eroding confidence in the U.S. financial system as a new Fed chair is appointed.
 PT14M44S
In this video market strategist Gareth Soloway analyzes the breaking of the 18‑year uptrend in the U.S. dollar (DXY), showing how technical patterns such as a bare‑flag formation, repeated hammer‑on the long‑term trend line and a potential breach of the 96‑97 level could trigger a roughly 10% decline by 2026 and spark a broader “financial earthquake.” He ties the dollar’s weakening to shrinking foreign demand for U.S. Treasuries, rising long‑term yields, and geopolitical stressors like the U.S. move against Venezuela, forecasting that the euro, pound and other major currencies will likely strengthen against the dollar while the dollar‑yen pair remains comparatively resilient.
 PT11M7S
produce.In this video chief market strategist Gareth Soloway breaks down a historic candlestick pattern that he says is repeating in crude oil, projecting a potential 50 % upside—approximately a breakout above $55 a barrel—by the first half of 2026. He then ties the technical case to fundamentals such as soaring data‑center energy demand, limited near‑term nuclear capacity, and a parallel outlook for natural gas, positioning the trade as a high‑probability, data‑driven opportunity.
 PT13M39S
.Bitcoin strategist Gareth Soloway outlines three chart‑driven reasons why BTC could rally in early 2026: a clean bare‑flag bull‑flag pattern holding support, the seasonal “January effect” that will release tax‑loss‑selling pressure, and a supportive reversal signal from MicroStrategy’s stock. He also argues the upcoming correction will be shallower than previous cycles, keeping the upside potential intact.
 PT12M2S
Veteran trader Gareth Soloway breaks down the recent price action in gold and silver using pure technical analysis, showing that gold’s daily trend line remains intact while silver has hit a short‑term top and may face a corrective pullback. He stresses probability‑based trading, highlights key support/resistance levels, and warns against hype‑driven, emotional decisions.
 PT8M13S
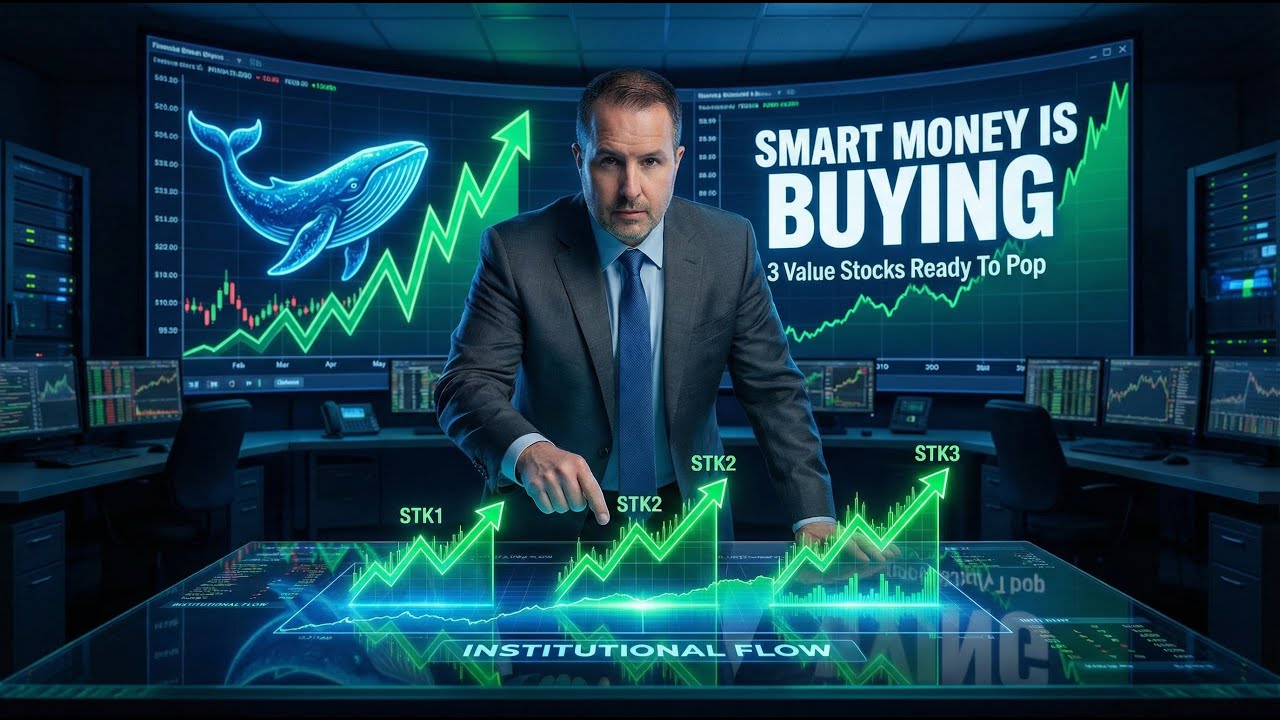
two sentences.The video from Verified Investing’s chief market strategist Gareth Soloway spotlights three large‑cap value stocks—Kraft Heinz ($KHC), Conagra Brands ($CGA) and Occidental Petroleum ($OXY)—that are trading at multi‑year lows and display bullish technical patterns such as wedge breakouts, an inverse head‑and‑shoulders, and long‑term trend‑line merges. He argues that their low forward P/E ratios, upcoming margin‑expansion or debt‑reduction catalysts, dividend yields and 2026 fundamentals could generate upside that outperforms the tech and AI sector.
 PT12M53S
Gareth Soloway breaks down the ongoing precious‑metal bull run, highlighting how historical silver bear markets are getting dramatically shorter and presenting a potential upside target of around $100 for silver. He extends the analysis to gold, platinum and palladium, suggesting price goals near $5,000, $2,500 and $2,350 respectively, and ties the momentum to rising U.S. debt and declining fiscal discipline.
 PT8M58S
In this video, Verified Investing’s chief market strategist Gareth Soloway breaks down technical patterns—such as bullish support bases, inside‑bar bull flags, and trend‑line breakouts—across major altcoins like ETH, XRP, SOL, ADA, AVAX, LINK, HBAR, and DOT, explaining why early January could set the stage for significant price rebounds. He argues that, if money rotates back from precious metals into crypto, many of these assets are poised for 20‑50% upside within weeks, though he cautions against expecting all‑time highs.
 PT13M20S
In this market‑analysis, Verified Investing’s chief strategist Gareth Soloway breaks down gold’s confirmed breakout above its previous all‑time high and projects the next resistance around $4,800, while also highlighting silver’s 505% surge since the 2020 COVID low and key technical levels for palladium, platinum and other commodities. He stresses chart‑based risk management by identifying potential downside triggers for each metal and explains why the current momentum could carry the rally through year‑end.
 PT10M8S
.Chief market strategist Gareth Soloway breaks down the latest metal charts, confirming gold’s breakout to near $5,000 with a bullish wedge pattern while warning of a likely short‑term pullback in silver after its 55% rally. He also identifies potential resistance zones for platinum around $2,300 and for palladium near $1,815, outlining trade setups for each metal.
 PT7M50S
.In this video, Verified Investing’s chief market strategist Gareth Soloway makes a contrarian case that crude oil could be the top‑performing asset in 2026, pointing to extreme bearish sentiment, record‑low oil‑to‑gold and oil‑to‑silver ratios, and inflation‑adjusted price discounts as a catalyst for a catch‑up rally. He predicts a potential 40‑50% upside to around $75 a barrel and warns that institutional players may already be loading up, positioning oil to outpace the S&P, gold, silver and even Bitcoin.
 PT16M45S
In this episode of Verified Investing, chief market strategist Gareth Soloway breaks down the current technical setups for a range of altcoins—including Ethereum, Solana, XRP, Cardano, Avalanche, Chainlink, Polkadot and others—highlighting higher‑low patterns and potential bullish bias for ETH while flagging downside risks and key support/resistance zones for the rest. He emphasizes a “charts‑only” approach, offering concrete price targets and trade‑management guidelines to help viewers identify short‑term buying opportunities and avoid speculative hype.
 PT10M40S
.In this video, Verified Investing’s chief market strategist Gareth Soloway breaks down Bitcoin’s current pull‑back using daily charts, bare‑flag patterns and historical four‑year cycle timing to pinpoint a likely bottom near the $66‑$69 k range before a potential upward swing. He also explains why this cycle’s drawdown may be only 45‑50 %—much less than past cycles—and what that means for both short‑term accumulation and long‑term holders.
 PT10M20S
Chief market strategist Gareth Soloway demonstrates that parallel trend lines on the S&P 500, Nasdaq 100, Russell 2000 and Bitcoin’s four‑year cycle all point to a major market top and a likely bear market by 2026, contradicting many analysts’ bullish S&P targets. He then recommends probability‑driven trades, including short‑term bearish positions and potential rebounds in stocks such as Oracle, FMC and FISV, all based on unbiased technical chart analysis.
 PT11M17S
sentences.In this video market strategist Gareth Soloway breaks down the recent explosive rally in silver, drawing key trend‑lines, parallel channels and measured‑move projections that point to near‑term resistance around $68‑$70 per ounce and a possible ultimate break toward $71‑$72 (or even $73) per ounce. He then shifts to gold, highlighting a bullish wedge‑break and bull‑flag setup that could push the metal past its all‑time high toward $5,000 per ounce, while warning that a break below the trend line would trigger a corrective pullback and buying opportunity.
 PT12M23S
sentences.Gareth Soloway breaks down the DXY’s long‑term support breach, showing how the 2025 tariff shock and accelerating “de‑dollarization” have turned a 27‑year uptrend into a potential downward spiral for the US dollar and outlining key resistance levels around 89.5‑96.6. He then applies the same technical lenses to EURUSD, GBPUSD and USDJPY, indicating bullish moves for the euro and pound, a weakening yen, and suggesting that a weaker dollar could lift gold, silver and Bitcoin.