📉 MSTR Rug Pull: How the $50 Drop Caught Everyone Off Guard
 PT10M15S
Apr 16, 2026, 5:40 AM•PT10M15S
 PT10M15S
 PT6M17S
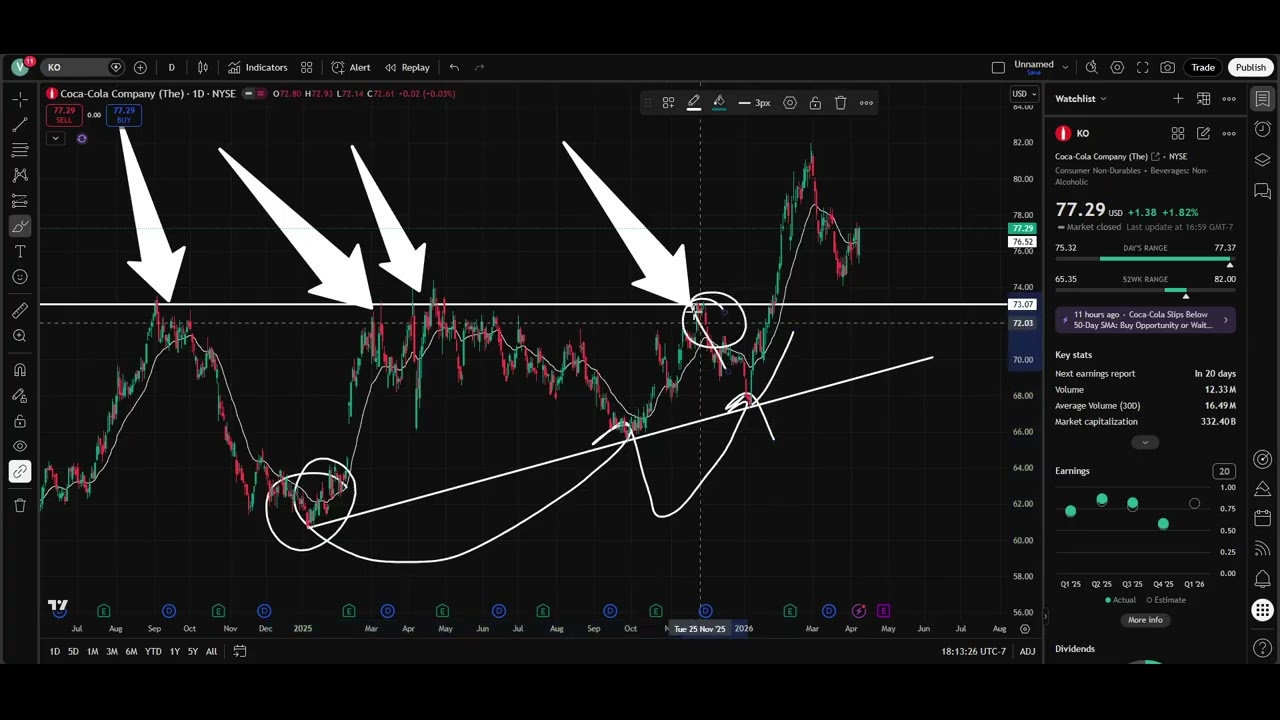 PT6M8S
 PT10M34S
 PT7M16S
 PT5M39S
 PT8M7S
 PT5M26S
 PT6M56S
 PT6M39S
 PT5M17S
 PT5M7S
 PT9M33S
 PT7M26S
 PT6M30S
 PT8M7S
 PT12M8S
 PT14M11S
 PT6M14S
 PT15M48S
 PT8M14S
 PT12M49S
 PT11M5S
 PT10M5S
 PT5M25S
 PT10M35S
 PT8M25S
 PT8M21S
 PT12M5S
 PT13M38S
 PT16M16S
 PT12M47S
 PT11M45S
 PT9M21S
 PT13M8S
 PT9M36S
 PT5M51S
 PT6M26S
 PT8M5S
 PT7M28S
V Trades breaks down the technical outlook for MicroStrategy (MSTR), noting the stock is stuck near 52‑week lows, still in a downtrend with a potential pullback to the $230 level and a long‑term target between $50‑$100, while highlighting upcoming earnings volatility. The analysis also touches on Bitcoin’s stagnant price action, its relative performance against gold, and the market’s tendency for rapid moves to reverse, concluding that accumulation may be favorable if MSTR stays below $100.