How Line Charts Give You Cleaner Levels and Trend Lines
 PT1H2M34S
Apr 13, 2026, 4:01 PM•PT1H2M34S
Observed vs Expected
| Metric | Observed | Expected |
|---|---|---|
| Views | 306 | 486 |
| Likes | 8 | 28 |
 PT1H2M34S
| Metric | Observed | Expected |
|---|---|---|
| Views | 306 | 486 |
| Likes | 8 | 28 |
 PT2H19M24S
| Metric | Observed | Expected |
|---|---|---|
| Views | 676 | 488 |
| Likes | 29 | 28 |
 PT1H32M17S
| Metric | Observed | Expected |
|---|---|---|
| Views | 165 | 488 |
| Likes | 7 | 30 |
end.In this walkthrough, the presenter demonstrates how to create a custom bond chart—adding the 2‑year, 10‑year, 20‑year, and 30‑year Treasury yields with specific colors, saving the layout, and placing it alongside other market monitors. He then explains bond fundamentals, the inverse link between yields and stock prices, key indicators such as the yield curve and spread, and practical tips for using bond data to guide trading decisions.
 PT12M53S
| Metric | Observed | Expected |
|---|---|---|
| Views | 649 | 489 |
| Likes | 67 | 30 |
In this heartfelt New Year’s Eve message, the speaker reflects on their trading journey and emphasizes the importance of humility and hard work for aspiring traders. They encourage viewers to take ownership of their success, stressing that nobody is inherently entitled to success and that meaningful progress comes from personal discipline and dedication.
 PT1H18M56S
| Metric | Observed | Expected |
|---|---|---|
| Views | 283 | 489 |
| Likes | 12 | 30 |
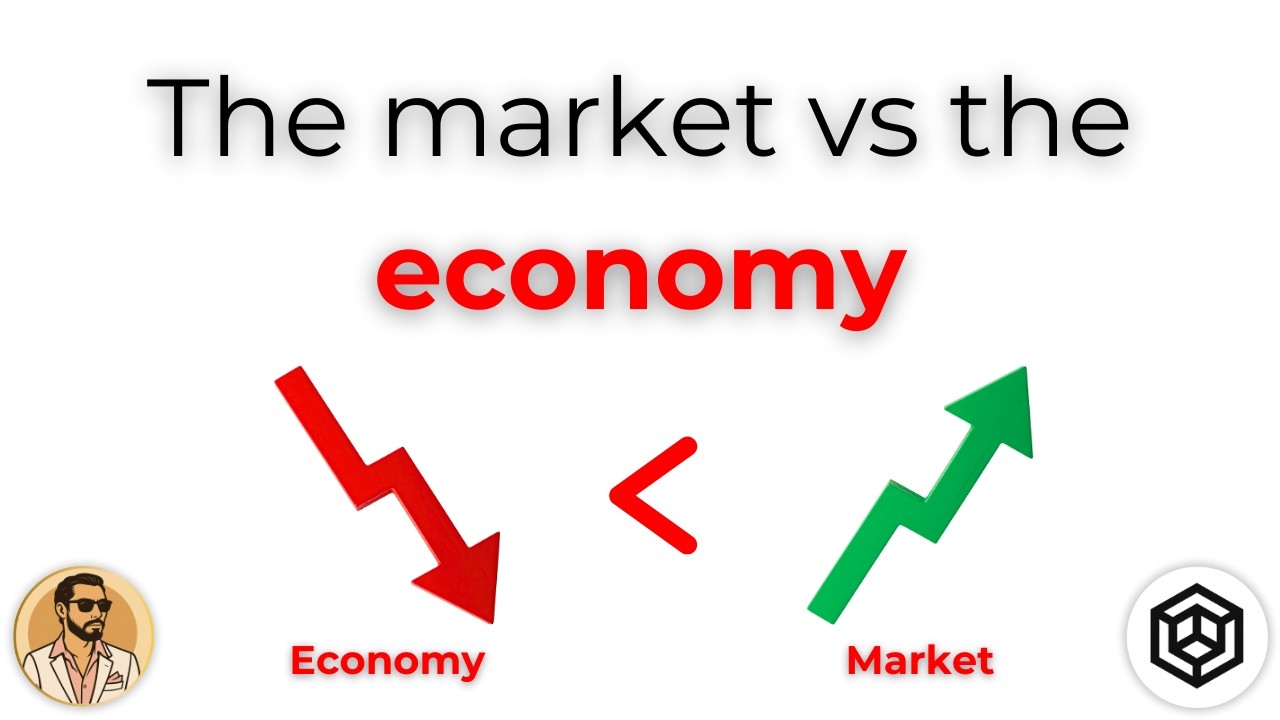
In this video, experts discuss the surprising market dynamics of 2025, when the S&P 500 reached all-time highs despite negative economic indicators such as rising unemployment and declining housing prices. They explore the implications of this disconnect between market performance and economic data, emphasizing the importance of understanding market trends and company fundamentals in navigating the financial landscape as they look towards 2026.
 PT1H34M48S
| Metric | Observed | Expected |
|---|---|---|
| Views | 1,114 | 489 |
| Likes | 68 | 30 |
In this video, the speaker shares valuable insights from nearly 13 years of trading experience, emphasizing that theoretical knowledge alone from books and videos is insufficient for trading success; active observation of historical price action is crucial. The discussion also dives into practical techniques, such as using Simple Moving Averages (SMAs) to identify trends and potential trade setups, making complex topics more accessible for both new and seasoned traders.
 41:01
41:01| Metric | Observed | Expected |
|---|---|---|
| Views | 495 | 489 |
| Likes | 30 | 30 |
In this trade recap video, Kevin, the market bishop, analyzes his successful trades from December 8th to December 12th, boasting a remarkable 96% options win rate and discussing key strategies behind high-profit trades, particularly those involving Tesla and the S&P 500. He highlights specific setups, such as the ascending scallop pattern and various key SMA indicators, which contributed to profits, showcasing how effective trade timing and risk management can lead to significant gains in options trading.
 51:02
51:02In this week’s trading recap, the presenter shares a mixed but ultimately profitable experience during a volatile trading week, highlighting significant trades like the successful Nvidia calls that saw impressive gains of up to 300%. Despite facing challenges on FOMC days and platform issues that led to missed opportunities, the recap emphasizes the importance of waiting for proper setups and maintaining risk management strategies.
 42:25
42:25In this video, the host shares a detailed recap of his trading activities from October 20th to October 24th, highlighting both successful trades and significant losses. He emphasizes the importance of learning from each trading experience to improve future strategies, providing insights into his decision-making process and technical analysis along the way.
 24:16
24:16In this video, we explore the Volume Weighted Average Price (VWAP), a key trading benchmark used to determine the average price of a security throughout the day, considering both price and volume. The tutorial covers how to set up VWAP on trading platforms, its significance for traders, and how it can serve as a tool for identifying trends, support, and resistance levels.
 55:13
55:13In this informative tutorial, discover how to effectively utilize exponential moving averages (EMAs) and simple moving averages (SMAs) for successful trading strategies. Learn the key differences between EMAs and SMAs, how to interpret golden and death crosses, and gain insights on combining these indicators for better decision-making in your trades.
 2:05:53
In "The Best Trading Platform," the presenter dives deep into the features of Thinkorswim, a trading platform recently acquired by Schwab, highlighting its usability for options trading and account management. The video provides insights into navigating the interface, utilizing various tools and statistics, and emphasizes the advantages of using Thinkorswim for both beginner and advanced traders.
 1:31:04
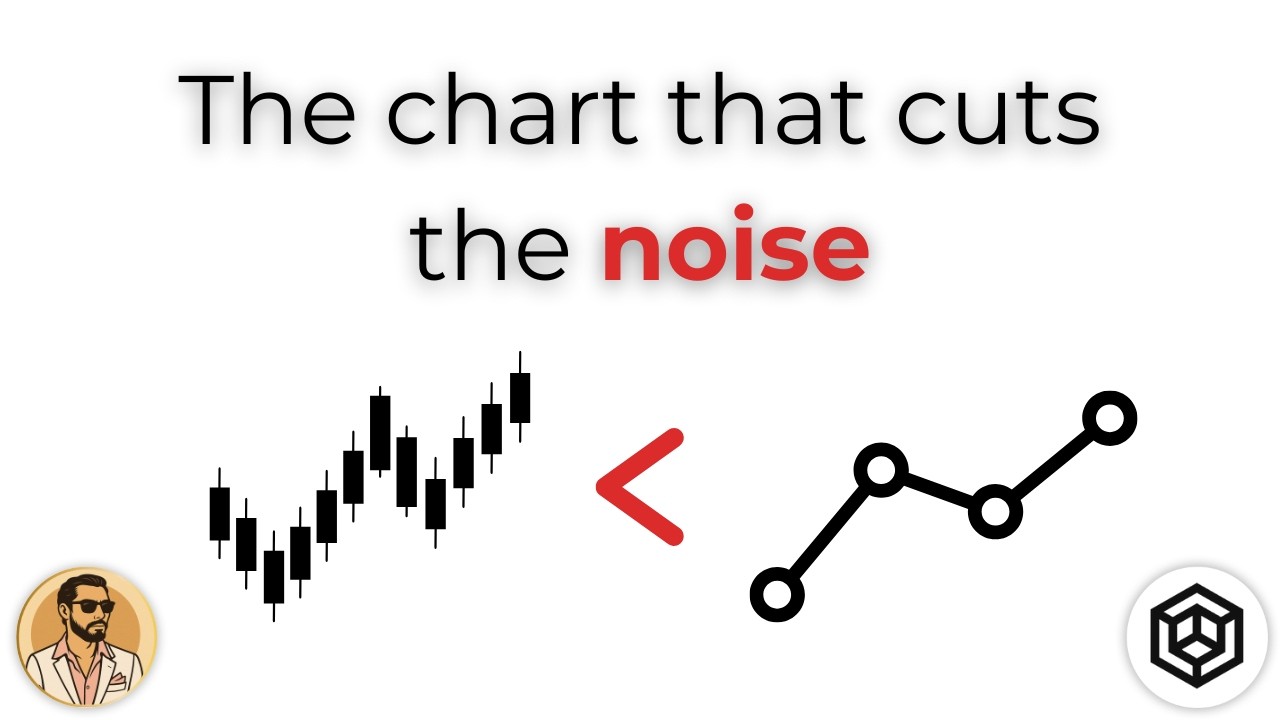
In this video, you'll learn how to simplify your trading strategy using line charts on TradingView, enabling you to cut through the noise and focus on key closing prices for better decision-making. Discover the advantages of line charts over candlestick charts, including how they help identify support and resistance levels, trend structures, and high-conviction setups without the distractions of intraday volatility.
 1:39:45
In this video, the host introduces Unusual Whales, a powerful tool for day trading options that tracks unusual activity and potentially indicates where institutional traders are placing their bets. He shares a personal success story of how he utilized the platform to identify profitable trades in Meta, demonstrating its effectiveness for both day trading and swing trading strategies.
 1:36:30
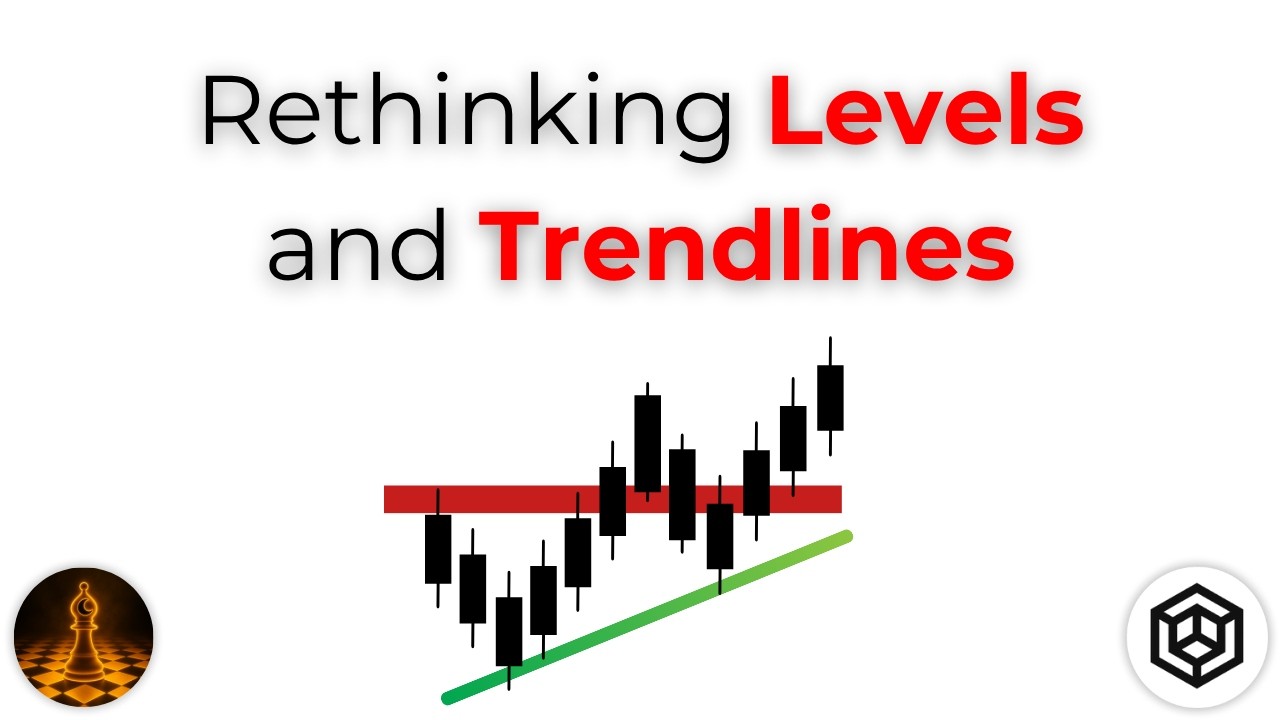
In this educational video, viewers will learn how to effectively draw levels and trendlines in trading, emphasizing the importance of understanding human emotions and market dynamics. The discussion covers key concepts such as identifying areas of interest rather than relying solely on support and resistance, and adapting techniques based on individual trading styles, ultimately aiming for successful long-term trading outcomes.
 1:40:44
In this informative video, the speaker delves into the concept of "gamma," a crucial Greek in options trading that describes how quickly an option's delta changes as the price of the underlying asset moves. By examining positive and negative gamma scenarios, the video highlights how options can significantly influence market behavior, volatility, and traders' strategies, providing valuable insights for both novice and experienced investors.
 2:17:48
In this video, the hosts simplify the concept of sector rotation, emphasizing its importance for traders looking to navigate both bullish and bearish markets. They share practical strategies for recognizing market shifts and successfully positioning trades based on economic cycles, using tools like S&P tactical watchlists and sector ETFs.
 1:41:28
In this video, options trading expert JP breaks down the fundamentals of call and put walls, explaining their significance in options trading and how they function as barriers that impact price movement. He shares strategies for identifying these walls and leveraging them for profitable trading, highlighting real-world examples to illustrate their importance in navigation, support, and profit-taking within the options market.
 2:44:30
In this informative video, the host discusses strategies for surviving a bear market, reflecting on the recent market downturn that began shortly after their last live session. They emphasize the importance of preparation, risk management, and education, urging viewers to adapt their trading approaches to navigate market volatility effectively.
 1:54:21
In this video, the discussion focuses on the recent University of Michigan consumer sentiment report, which raised concerns about increasing inflation expectations and its potential impact on the stock market. The host explores trading strategies in response to current market conditions, emphasizes understanding economic data, and highlights specific stock opportunities amid overall market volatility.
 2:14:59
In this video, we delve into essential risk management strategies for options trading, emphasizing the significance of understanding personal trading psychology and market volatility. The host shares insights from years of experience, highlighting the importance of preparing a tailored risk management plan to navigate both day trading and swing trading effectively, particularly in challenging market conditions.
 2:02:38
In this informative live session, our host discusses recent trades, focusing on positions in Johnson & Johnson, Merck, Coca-Cola, and General Mills, while explaining the strategy behind choosing low beta stocks during a bearish market. Viewers are encouraged to ask questions about trading strategies and mental approaches, as the speaker shares insights on managing emotions, developing a trading plan, and understanding market rotations.